Data Analytics
Decision-ready analytics from fragmented data .
We unify operational data, define trusted metrics and build dashboards that make performance, risk and opportunity easier to act on.
Power BIData modelsKPIs
INSIGHTERZ / SYSTEM MAP REFERENCE
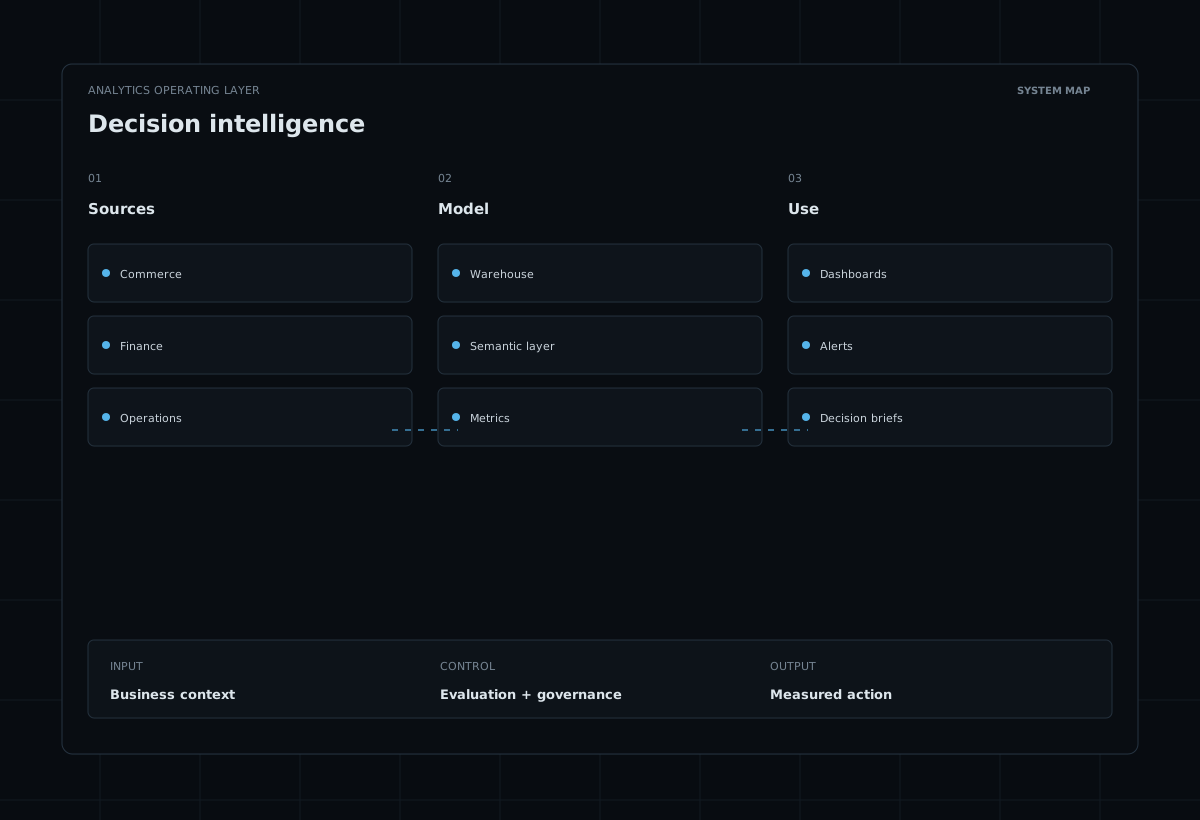
System lensContext → System → Outcome
Working modeDesigned for production
DiscoverModelBuildImprove
01 / What we build
Analytics built around decisions, not dashboard count.
We model the business first, then create reporting experiences that reveal what changed, why it changed and where to focus.
02 / Delivery
A reporting foundation teams can trust.
Metric definitions, lineage, refresh logic and permissions are treated as product requirements — not afterthoughts.
- Single metric definitions
- Reconciled source systems
- Role-based access
- Refresh and quality monitoring
03 / Use cases
Where this capability creates value.
Executive reporting
Designed around your data, users, operating constraints and measurable business outcome.
Sales analytics
Designed around your data, users, operating constraints and measurable business outcome.
Finance performance
Designed around your data, users, operating constraints and measurable business outcome.
Customer analytics
Designed around your data, users, operating constraints and measurable business outcome.
Operations dashboards
Designed around your data, users, operating constraints and measurable business outcome.
Marketing attribution
Designed around your data, users, operating constraints and measurable business outcome.
04 / Engagement
A practical path from idea to production.
Discovery
Problem, workflow, users, data and value.
Prototype
Technical proof with measurable evaluation.
Production
Integrations, controls, UX and deployment.
Improve
Monitoring, feedback and optimization.
Operating metrics
Dashboards become useful when metrics have clear definitions, owners and actions.
We connect the data model and the operating cadence so a KPI means the same thing across teams.
CAPABILITY / SYSTEM MAPcontrolled
SOURCEOperational systemsCRM · ERP · commerce
MODELTrusted metricsDefinitions · lineage
VIEWDecision interfaceBI · alerts · drill-down
ACTOperating cadenceOwner · action · review
Operating model
Decision systems that turn scattered metrics into one operating view.
Good analytics reduces arguments about numbers and increases time spent on the decisions behind them.
- Create shared KPI definitions
- Model data around business decisions
- Design dashboards for action, not decoration
Technology stack
Technology selected around the operating requirement.
SQLdbtPower BIPythonPostgreSQLSnowflake
FAQ
Questions teams usually ask before they start.
Scope, data readiness, ownership and evaluation are clarified before a build is treated as a production commitment.
Usually yes. Discovery starts by mapping the systems, data quality, APIs and workflow constraints already in place.
No. We can work as a focused delivery partner while keeping ownership, documentation and operational handoff clear for your team.
We define technical and business acceptance criteria before production scope expands, then monitor the same signals after launch.
Start with the problem
Explore what data analytics can do for your business.
Bring us the workflow, decision or customer experience you want to improve. We will help define a pragmatic solution.